한국인 췌장암 환자의 혈장 대사체 프로필
Metabolic Profiling of Plasma from Pancreatic Cancer Patients in Korea
Article information

Abstract
배경/목적
췌장암은 일반적으로 불량한 예후를 보이며, 조기 진단이 어렵다는 점이 이에 영향을 미칠 것으로 생각되고 있다. 본 연구는 한국인 췌장암 환자에 있어서 혈장내 대사체 분석을 시행하여 건강 자원자의 대사체 프로파일과 비교하였다.
방법
각 10명으로 비한국인들을 대상으로 이루어진 기존 연구에 비하여 대상자 수가 매우 적지만 검진으로 시행한 복부 CT상 췌장 질환의 증거가 없는 건강한 자원자를 모집하였으며, 이는 췌장암의 조기 진단이 어렵다는 점을 감안할 때 기존 연구에 비한 장점이 될 수 있겠다.
결과
혈장내 대사체 비교 분석상 췌장암 환자에서 L -lysine의 혈장 농도는 1.36배 높고 L -leucine은 0.63배, palmitic acid는 0.93배 낮은 것으로 나타나 이 세 가지의 대사체 프로파일의 조합이 건강자원자와 췌장암 환자를 가장 잘 구분해 주는 것으로 나타났다.
결론
앞으로 췌장암의 조기 진단 혹은 발생 역학의 규명을 위하여 대사체 분석에 대한 연구가 더 필요하겠다.
Trans Abstract
Backgrounds/Aims
Pancreatic cancer (PC) patients have poor prognoses because this cancer is typically diagnosed at an advanced stage and the therapeutic options are limited. We examined the potential of metabolic profiling for early diagnosis and identification of potential therapeutic targets.
Methods
Ten patients and 10 healthy volunteer controls older than 20 years of age were enrolled between May and December 2015. The patients were confirmed to have pancreatic ductal adenocarcinoma cytologically or histologically. Blood plasma samples were derivatized and analyzed by gas chromatography mass spectrometry (GC-MS). Untargeted GC-MS data were analyzed using statistical methods, including Wilcoxon rank-sum test and principal component analyses.
Results
L-lysine was 1.36-fold higher in patients than in healthy controls (p<0.05). L-leucine was 0.63-fold lower (p<0.01) and palmitic acid was 0.93-fold lower (p<0.5) in patients than in controls. Orthogonal partial least squared-discriminant analysis revealed significant differences between the patients and controls.
Conclusions
This study suggests that the metabolic profiles of patients with PC are distinct from those of the healthy population. Further studies are required to develop methods for early diagnosis and identify therapeutic targets.
INTRODUCTION
The 5-year survival rate of patients with pancreatic cancer (PC) was only 2% in the USA between 2005 and 2011 [1]. In Korea, the 5-year relative survival rate of patients with PC was 9.4% between 2009 and 2013 [2]. This poor prognosis can be largely ascribed to the lack of efficient diagnostic screening tests and limited efficacious therapeutic options [3]. The invasiveness and cost of diagnosis methods such as endoscopic ultrasonography or helical computer tomography (CT) scanning make it difficult to diagnose PC at an early stage [4].
Numerous studies have shown that cancers alter their metabolism to survive and proliferate [5,6]. In metabolic profiling, the complement of metabolites and their intermediates in a biological system are measured, which reflects dynamic responses to physiological or pathophysiological stimuli [7]. Therefore, tools for early diagnosis of PC using metabolic profiling have been developed [8-10]. However, no have examined metabolic profiling in Korean patients with PC. We evaluated the potential of metabolic profiling for early diagnosis in Korean patients with PC.
METHODS
1. Subjects
Ten patients with PC and 10 healthy volunteer controls (HCs) older than 20 years of age were enrolled between May and December 2015 in Pusan National University Hospital. Patient diagnosis was cytologically or histologically confirmed as pancreatic ductal adenocarcinoma. The HCs underwent abdominal CT scans for health screening and showed no evidence of PC. No evidence of PC was the only inclusion criterion for the HCs. All enrolled subjects signed informed consent. This study was approved by the Institutional Review Board (IRB number H-1504-001-028).
2. Plasma sample preparation
Approximately 9 mL of blood was collected from each subject into tubes containing ethylenediaminetetraacetic acid and centrifuged at 1,800 ×g for 8 minutes at 4℃. Plasma metabolites were extracted by adding 1 mL of a working solution composed of acetonitrile, isopropanol, and water (3:3:2) containing isotopelabeled internal standards at a concentration of 1.25 μg/mL (tyrosine-3,3-d2, glutamic acid-2,3,3,4,4-d5, alanine-2,3,3,3-d4, phenylalanine-phenyl-d5-2,3,3,-d3, and myristic acid d27) to 30 μL of plasma [11]. The samples were vortexed and then centrifuged at 13,000 ×g for 10 minutes at room temperature. The supernatant was divided into two parts of 500 μL each for gas chromatography-mass spectrometry (GC-MS).
The samples were analyzed by GC-MS (Agilent Technologies, Santa Clara, CA, USA). The data were acquired by an untargeted method using Agilent 5975C MSD and 7890A GC instruments. The GC-MS system was equipped with an electron impact ionization source. An Agilent J&W DB-5MS column (30 m × 0.25 mm × 0.25 μm film 95% dimethyl/5% diphenyl polysiloxane) was installed and calibrated. The GC-MS data were acquired over 37.5 minutes with a 5.9-minute solvent delay at a normal scan rate in the mass range 50-600 Da [11]. GC-MS analysis of 20 samples was conducted twice (August 24, 2016 and August 29, 2016).
3. Data analysis
The raw chromatogram data were converted to netCDF format by using the automated mass spectral deconvolution and identification software (AMDIS) included with the NIST 02 mass spectral library (version 2.0; Agilent Technologies). The XCMS package in the open-source R software (version 3.2.4; https://www.r-project.org) was used to process the converted data for peak detection, nonlinear retention time alignment, and quantile normalization for metabolic data processing. The preprocessed dataset was imported into MetaboAnalyst (http://www.metaboanalyst.ca), and multivariate statistical analyses based on Wilcoxon rank-sum test were performed. Orthogonal partial least squared-discriminant analysis was performed to identify discriminants between the two sample groups. The variable importance in the projection value was used to identify the metabolite with the highest contribution to the alteration.
RESULTS
1. Demographic and anthropometric information
Table 1 shows the demographic and clinical characteristics of the 10 patients with PC and 10 HCs. In most patients, the cancer was present in the pancreatic head. Seven of 10 patients had diabetes mellitus. One HC had well-controlled diabetes mellitus. All HCs and two of 10 patients with PC had normal carbohydrate antigen 19-9 (CA19-9) levels, although all patients were in stage 3 or 4.

Characteristics of the study cohort
2. Selection and identification of metabolites
The orthogonal partial least squared-discriminant analysis score plot showed a significant separation between the two groups (Fig. 1). According to the variable importance in the projection value (=1.0), the 279 ion peaks were searched in the NIST 02 mass spectral library based on the accurate mass value, mass chromatogram patterns, and structure information. By comparing the mass chromatogram patterns, seven metabolites were identified (Table 2): L -leucine, glycine, L -proline, L -lysine, palmitic acid, linoleic acid, and stearic acid.
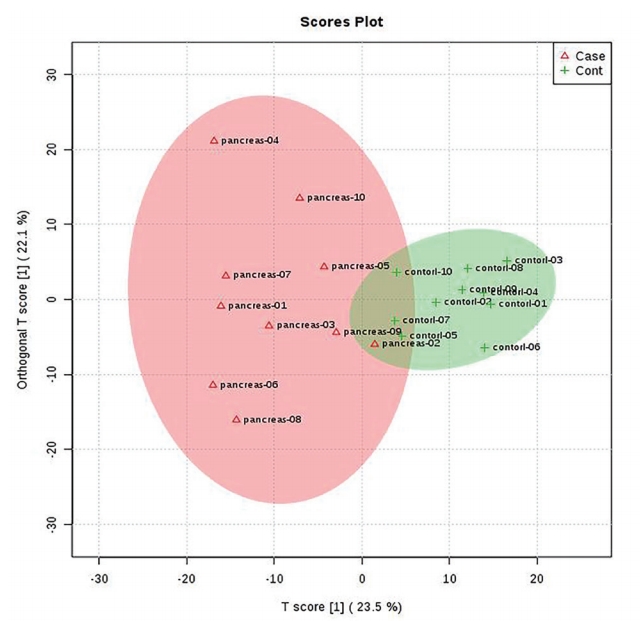
Orthogonal partial least squares-discriminant analysis score plot of healthy controls (+HCs, n=10) and pancreatic cancer patients (Δpatients, n=10).

Differential metabolites in patients and healthy subjects
Biomarker analysis using MetaboAnalyst revealed that three of the seven metabolites were clinically significant (Fig. 2). L -lysine was increased by 1.36-fold (p <0.05) and L -leucine was decreased by 0.63-fold (p <0.01) in the patient group. Palmitic acid was decreased by 0.93-fold (p <0.5) in the patient group. Fig. 3 shows the individual receiver operating characteristic (ROC) curves and fold changes. ROC analysis was conducted to characterize the selected metabolites. The area under the curve parameter for the two metabolites (L -leucine and L -lysine) was 0.731, which was in agreement with the value for the three metabolites (Fig. 4). Marker performance was assessed by estimating sensitivity, selectivity, and accuracy in patients with PC by applying the model.
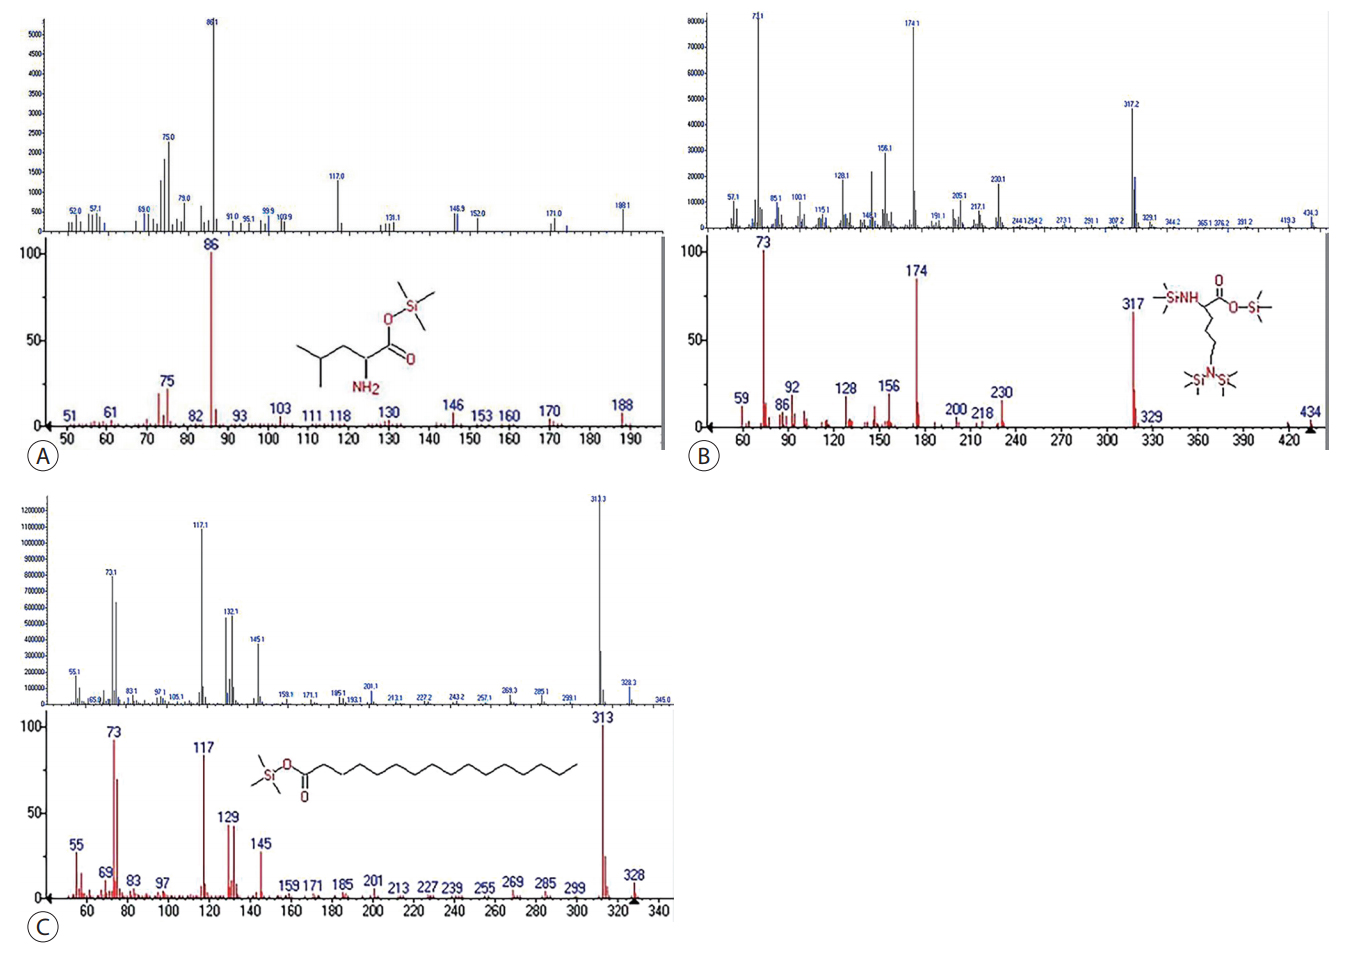
Identification of (A) L-leucine (86 m/z), (B) L-lysine (233 m/z), and (C) palmitic acid (328 m/z). MS spectra of corresponding spectral features in samples of this study (upper). MS spectra of NIST 02 mass spectral library and chemical structure of derivative L-leucine, L-lysine and palmitic acid (bottom). The spectral features of upper and bottom in each figure are similar. MS, mass spectrometry; NIST, National Institute of Standards and Technology.
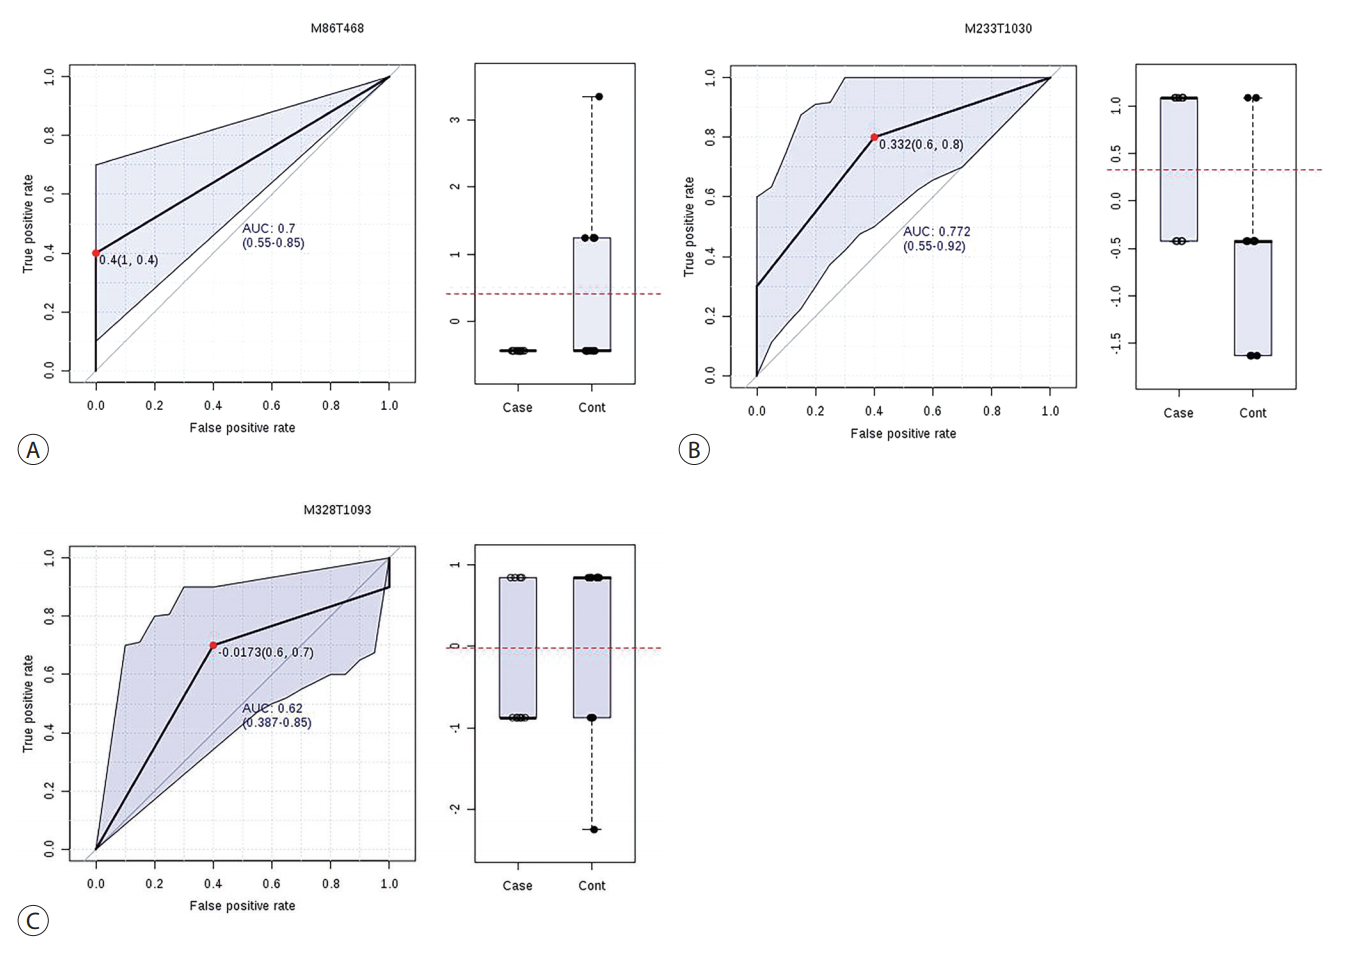
Individual ROC curve for (A) L-leucine, (B) L-lysine, and (C) palmitic acid. Box and whisker plots of three metabolites show fold-changes of concentrations. The AUC with 95% confidence interval are 0.7 (0.55-0.85), 0.772 (0.55-0.92), and 0.62 (0.387-0.85) for each curve. Cut-off values (false positive rate; 1-specificity, true positive rate; sensitivity) of three metabolites are 0.4 (1, 0.4), 0.332 (0.6, 0.8), and -0.0173 (0.6, 0.7). AUC, areas under the curve; ROC, receiver operating characteristic.
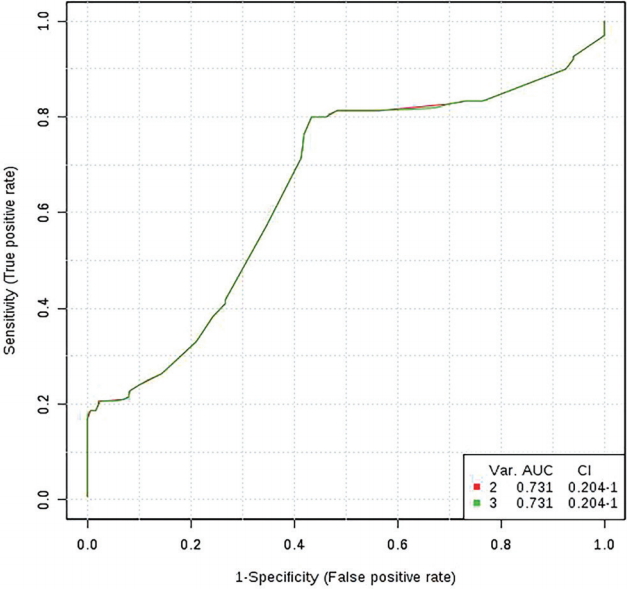
Multivariate receiver operating characteristic curve analysis. The AUC parameter for the two metabolites (L-leucine and L-lysine) was 0.731 (red line), which was the same as the value for the three metabolites (green line). AUC, area under the curve; CI, confidence interval.
Two PC patients with normal level of CA19-9 had a different metabolite profile from the patients with increased CA19-9. L -lysine was down in eight PC patients with increased CA19-9 had somewhat different metabolite profile (p <0.05). Palmitic acid in patients with normal CA19-9 was increased comparing with HC while it was decreased in patients with increased CA19-9 (p <0.001). L -proline (p <0.001), glycine (p <0.001) were down as shown in the whole patients group. Stearic acid was up in these two patients as well (p <0.001). Two patients are too small to analyze with the orthogonal partial least squared-discriminant analysis.
DISCUSSION
Numerous studies have attempted to develop efficient diagnostic methods for PC. For example, metabolic profiling of plasma or serum metabolite biomarkers using techniques such as nuclear magnetic resonance spectroscopy or liquid chromatography-mass spectrometry has been evaluated [8-10,12]. This is the first study to compare the metabolic profiles of Korean patients with PC to those of HCs. All HCs in this study were evaluated by abdominal CT to exclude pancreatic lesions. However, our sample size was small and our laboratory equipment was limited, leading to the identification of only three discriminative metabolites.
GC-MS is useful for detecting amino acids or organic acids. Various studies have reported that plasma-free amino acids such as threonine, glutamine, glycine, proline, leucine, and lysine are decreased in patients with PC [9,13-15]. One study suggested that plasma serine was decreased because cancer cells consume and convert serine to intracellular glycine and one-carbon units to build nucleotides [13]. However, a Japanese group reported discrepant findings, including increased plasma serine in patients with PC [14]. The authors suggested that the large number of subjects (patients with PC, n=360; HCs, n=8,372), variations in the sample preparation conditions and analytical methods, and diurnal fluctuations in plasma-free amino acid levels may have contributed to these discrepancies.
A group of Japanese researchers suggested an 18-metabolite panel, including glycine, proline, and lysine, with a sensitivity of 71.4-86.0% and specificity of 78.1-88.1% [9]. They also used GC-MS (QP2010 Ultra; Shimadzu, Kyoto, Japan) and validated their model in patients with PC and chronic pancreatitis. Their model was based on stepwise variable selection and subsequent multiple logistic regression analysis rather than on principal component analysis. In accordance with our findings, they reported that glycine and proline were decreased in patients with PC. In contrast, lysine was decreased in patients with PC compared to in HCs in the present study. Tumor location, histology, and stage [9] were similar to those in the present study, but the previous study also included a small number of patients with stage 1 and 2 disease. Thus, further studies of a larger number of subjects are required to identify context-dependent differences. Serial assessment may also provide more valuable data.
Lysine methylation signaling has emerged as a promising therapeutic target for PC because of its high specificity and reversibility [16]. Some lysine methyltransferase inhibitors showed preclinical effects in a PC animal model [17,18]. Decreases in leucine levels in PC have been reported in some studies, in accordance with our findings [13,14]. This may be because of leucine consumption by tumor cells or concomitant malnutrition. Leucine supplementation reportedly enhanced tumor growth in a murine model of PC [19]. Some athletes and cachexic patients consume leucine supplements because it activates mammalian target of rapamycin (mTOR) and enhances the growth and proliferation of myocytes and epithelial cells.
An Italian group reported that the area under the ROC curve of serum palmitic acid was significantly higher than that of CA19-9 [20]. Thus, measurement of palmitic acid could be more precise than that of CA19-9. While the present study revealed a modest decrease in palmitic acid in patients with PC, their study showed 20-fold lower concentrations. Saturated fatty acids such as palmitic acid promote insulin resistance, which may be involved in PC development [21]. Saturated fatty acids also upregulate the production of proinflammatory cytokines, including tumor necrosis factor-α and interleukin-6, as well as provide a source of reactive oxygen species by increasing lipid peroxidation [22,23]. Palmitic acid was reported to induce a toll-like receptor 4 (TLR4)-mediated invasion in human PC cells as well [24]. Lipopolysaccharides, especially saturated palmitic acids are natural TLR4 ligands that have been shown to increase the invasive ability of PC cells.
In this study, the fold-change in palmitic acid was 0.93, which is close to 1, and the area under the ROC curve was 0.62, which is less than 0.7. The discriminating power of palmitic acid does not appear to be specific, and the MetaboAnalyst suggested that a combination of L -leucine, L -lysine, and palmitic acid is the optimal discriminating profile. Palmitic acid was up in the PC patients with normal CA19-9 unlike in the patients with increased CA19-9. It might be related to recruitment and consumption of palmitic acid according to the development of PC.
In this study, seven of 10 patients with PC had diabetes mellitus (DM), while only one of 10 HCs had this disease. Metabolites may be affected by not only PC but also DM. Although many studies of the metabolic profiles of PC excluded patients with DM, a Chinese study showed that patients with PC, patients with DM, and HCs had significantly distinct metabolite profiles [25]. They evaluated the serum of 50 patients with PC, 50 patients with DM, and 50 healthy subjects by GC-MS and principle component and discriminant analysis. Further studies are needed to evaluate how DM influences PC.
Recently, Korean researchers developed a proteomic multimarker panel that included leucine-rich alpha-2 glycoprotein (LRG1), transthyretin, and CA19-9, with a sensitivity of 82.5% and specificity of 92.1% [26]. Although the origins and functions of LRG1 and transthyretin are unclear, the authors suggested that these proteins are highly relevant to PC. In their study, the target markers were not confined to metabolites, and this triple-marker panel appears to be useful for patients with PC and low CA19-9.
This study suggests that the metabolic profiles of patients and the healthy population may be distinct. Serial metabolic profiling may shed a light on the dynamics of PC and potential therapeutic targets for it.
Notes
Conflict of Interest
The authors have no conflicts to disclose.
Acknowledgements
This work was supported by a clinical research grant from Pusan National University Hospital in 2018.