담관암에서 성장인자-매개 암 진행과 전이
Growth Factor-mediated Tumor Progression and Metastasis in Cholangiocarcinoma
Article information
Trans Abstract
Different ligands can lead to the activation of epidermal growth factor receptor, and the subsequent signal transduction leads to an increase in cellular motility, proliferation, invasion, and blocking of apoptosis, and all of this contributes to the development and progression of cancer. Our studies clarified; 1) The EGFR expression level is reduced during tumor progression or during ligand-induced EGFR activation. 2) ANXA8 and its regulatory pathway may well be alternative, strategic targets for inhibiting tumor metastasis. 3) The molecular pathway of EphA2 signaling and provide insight into the mechanisms that control cancer progression and metastatic spread in cholangiocarcinoma (CC). Therefore, therapeutic strategies that target EphA2 and its downstream effectors may be useful to control CC.
INTRODUCTION
Human cholangiocarcinoma (CC) is a highly malignant, generally fatal neoplasm originating in the bile duct epithelial cells or cholangiocytes of the intra- and extrahepatic biliary system. The prognosis for CC is quite poor because of difficulties in early diagnosis, and relative resistance of the tumors to chemotherapy [1,2]. At the time of diagnosis, approximately 70% of CC patients have an occult metastasis or advanced local disease that precludes curative resection [3]. Mortality rates have risen sharply in recent years and because CC has no proven adjuvant therapy, only surgical resection with tumor- free margins is associated with improvement in survival, with 5-year survival rates in the range of 20-40% [4]. However, resection is precluded by distant metastases, extensive regional lymph node metastasis, and vascular encasement or invasion.
Abnormal epidermal growth factor (EGF) and EGF receptor (EGFR) signaling can also participate in the genesis and progression of CC [5]. There is accumulating evidence implicating EGF and EGFR signaling pathways that regulate or mediate the epithelial-to-mesenchymal transition (EMT) in the development of CC [6,7]. However, reduced EGFR expression and activation was shown to correlate with a lack of differentiation in CC, even in CC with an altered EMT [8]. The molecular mechanism underlying tumor progression, by which tumor cells acquire the phenotypes of invasiveness and metastasis, is therefore still unclear in CC.
The current chemotherapy regimen that is used to treat CC has very limited benefit in terms of patient survival. Sarcomatoid (SC) CC is predominantly composed of spindle cells, giant cells, and bizarre cells and is believed to have an epithelial origin with transformation to the sarcomatous type. The sarcomatoid change in CC, referred to as the EMT, contributes to a more aggressive intrahepatic spread and widespread metastasis, and CC with a sarcomatoid change has a poorer prognosis than ordinary CC [9,10].
GENOME-WIDE EXPRESSION PATTERNS ASSOCIATED WITH ONCOGENESIS AND SARCOMATOUS TRANSDIFFERENTATION OF CHOLANGIOCARCINOMA
1. Gene expression patterns distinguish CC cells from cultured normal biliary epithelial (NBE) cells
Using BeadChip microarray analysis, we compared the gene expression profiles of nine CC cell lines, an immortalized biliary epithelial cell line, and four types of NBE cells. We selected 828 unique genes with a 2-fold or greater expression difference from the mean, with a p < 0.01 by t-test. Unsupervised hierarchical clustering analysis of all samples was based on the similarity in the expression pattern of all genes (Fig. 1). Cell samples were separated into two main groups, the NBE cluster, and the transformed and immortalized biliary epithelial cells (cholangiocarcinoma cells, CCC cluster). Each distinctive gene cluster was identified by delineation using a hierarchical clustering dendrogram. Cluster I consisted of genes upregulated in CC cells, which included tumor-related genes such as LGR4, AGR2, PCAF, TMEM97, FRAT2, EFNB2 and ZIC2. Cluster II included genes underexpressed in CC cells. These were mainly tumor suppressor genes such as GREM1, THY1, STC2, SERPINE1, SPARC and TAGLN. Cluster III was genes upregulated in NBE cells, and contained the PDGFRA, CD248, and BDKRB1 genes.
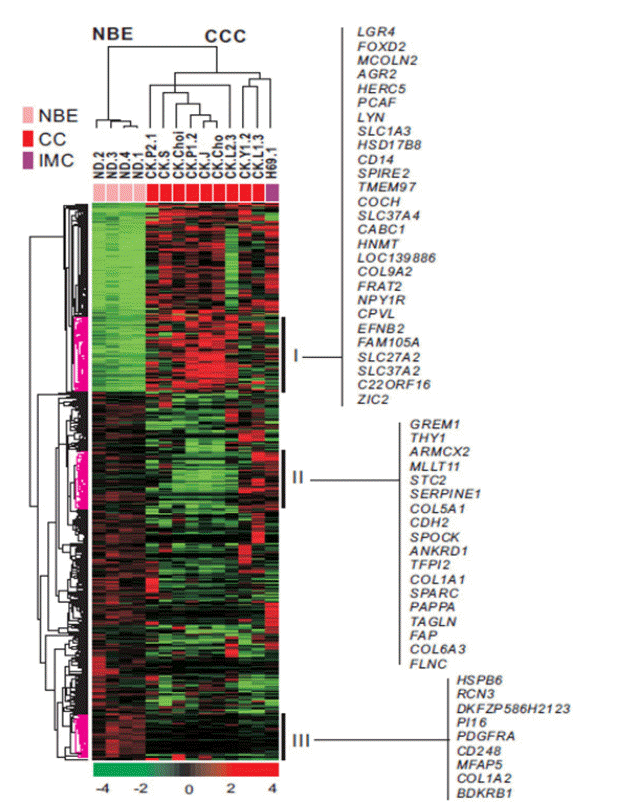
Unsupervised hierarchical clustering of four biliary epithelial cells,one immor talized cholangioc y te cell line and nine CC cells. Unsupervised hierarchical clustering separated the samples into twomain groups, normal biliary epithelial (NBE) cells isolated from mucosalslices of normal bile ducts and ex-vivo cultured as described in Methods,and cholangiocarcinoma cells (CCC). Data are in matrix format, withcolumns representing individual cell lines and rows representing each gene. Red, high expression; green, low expression; black, no significant change in expression level between the mean and sample. A hierarchical clustering algorithm was applied to all cells and genes using the 1-Pearson correlation coefficient as a similarity measure. Raw data for a single array were summarized using Illumina BeadStudio v3.0 and output to the user was as a set of 43,148 values for each individual hybridization. We selected 828 unique genes with a two-fold or greater difference from the mean and p < 0.01 by t-test, for hierarchical clustering analysis. Specific gene clusters (Cluster 1 through Cluster III) were identified in the hierarchical cluster of the genes differentially expressed in CCC compared with NBE. CC, cholangiocarcinoma; IMC, immortalized cholangiocytes.
2. Gene expression patterns distinguish CC tissues from cultured NBE cells
Using BeadChip microarrays, gene expression profiles of 19 CC tissues and 4 types of NBE cells were compared. We selected 1,798 unique genes with 2-fold or greater differences from the mean difference with a p < 0.01 by t-test. Unsupervised hierarchical clustering analysis was as described above (Fig. 2A). All samples separated into two main groups, NBE and CC tissues (CCT). Each distinctive gene cluster was identified using a hierarchical clustering dendrogram as above. Intriguingly, the CC sample cluster was divided into two subclasses by tumor differentiation: differentiated (Df) and undifferentiated (Udf). Clustering data for the CC group revealed three clusters. Cluster I had genes upregulated in NBE and downregulated in CCT including SERPINB2, PAPPA, LRRC17, and GREM1. Cluster II contained genes upregulated in the Df CCT and downregulated in NBE. Cluster III included genes upregulated in poorly differentiated or Udf CCT, and downregulated in NBE. A supervised hierarchical clustering analysis was performed between the NBE class, and the Df and the Udf subclasses based on the similarity of expression pattern of all genes (Fig. 2B, C).
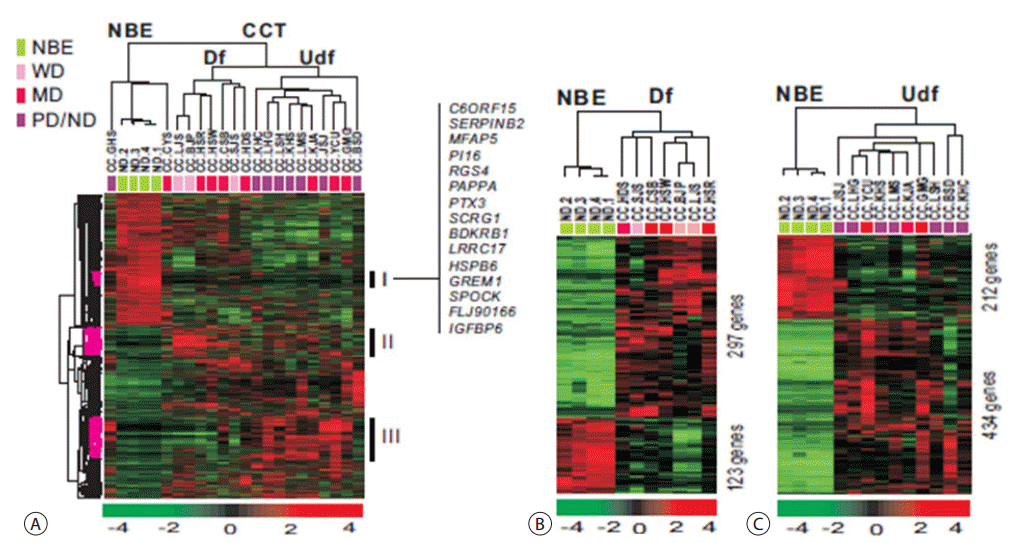
Unsupervised hierarchical clustering of 4 biliary epithelial cells and 19 CC tissues. (A) Unsupervised hierarchical clustering separated the samples into two main groups. We selected 1798 unique genes with two-fold or greater difference from the mean with p < 0.01 by t-test for hierarchical clustering analysis. Specific gene clusters (Cluster 1 through Cluster III) were identified of differentially expressed in CCT compared to NBE. (B)Supervised hierarchical clustering of four biliary epithelial cells and seven differentiated CC tissues. We selected 420 unique genes with four-fold or greater difference from the mean and p < 0.01 by t-test for hierarchical clustering analysis. (C) Supervised hierarchical clustering of 4 biliary epithelial cells and 10 undifferentiated CC tissues. We selected 646 unique genes with the criteria in B for hierarchical clustering analysis. NBE, normal biliary epithelial; WD, well differentiated; MD, moderately differentiated; PD/ND, poorly differentiated; CCT, cholangiocarcinoma tissues; Df, differentiated; Udf, undifferentiated; CC, cholangiocarcinoma.
3. Differential expression and verification of CC-related genes
We compared the gene lists from the cell-based and tissue-based databases, and selected 342 commonly regulated genes, including 53 commonly upregulated genes and 289 commonly downregulated genes (Fig. 3A). To verify the microarray data, we examined the mRNA levels of the identified genes using real-time reverse transcription polymerase chain reaction (RT-PCR) in human CC tissues. We selected five up-regulated genes from the commonly upregulated genes of both the cell and tissue sample classes (Fig. 3B). We also chose the IRX3, PTTG1, and PPARγ genes, which were highly upregulated in only the cell sample class. These genes were preferentially expressed in CC cells and tissues. We also examined the expression of the commonly downregulated KRT17 and UCHL1 genes, as well as the cellular downregulated IGFBP7 and SPARC genes using real-time RT-PCR in human CC. The human NBE showed substantial expression of CK-17, UCHL1, IGFBP7 and SPARC, which were barely detected in CC tissues (Fig. 3C).

Differentially regulated genes in human CC tissues compared to NBE cells. (A) Venn diagram of genes commonly regulated in the cell and tissue samples. The 342 genes included 53 upregulated and 289 downregulated genes, selected from the cell- and tissue-based microarray databases. (B) Real-time RT-PCR analysis of upregulated genes selected from the list of top 25 genes commonly upregulated in both CC cells and tissues compared to cultured NBE cells. (C) Real-time RT-PCR analysis of downregulated genes selected from the list of top 25 genes commonly downregulated in both CC cells and tissues compared to cultured NBE cells. *, selected from only the cell-based microarray database. C, cells; T, tissues; N, normal biliary epithelial cells; CC, cholangiocarcinoma; NBE, normal biliary epithelial; RT-PCR, reverse transcription polymerase chain reaction.
4. Gene expression patterns distinguish the sck cell line from three CC cell lines
Previously, we established four human CC cell lines and characterized one with a typical sarcomatoid phenotype of SCK. We classified the other cell lines according to tumor cell differentition, as a poorly differentiated JCK, a moderately differentiated Cho-CK, and a well-differentiated Choi-CK cell line [11]. Two-way unsupervised hierarchical clustering analysis of quadruplicate samples for each cell line was conducted, based on the similarity of expression patterns of all genes (Fig. 4A). We selected 559 unique genes whose expression differed from the mean by four-fold or more with p < 0.005 by t-test. Cell samples were separated into two main groups, SC and ordinary or adenocarcinomatous CC (AC), by the gene axis. Genes in cluster I appeared to be downregulated in the SCK cells, compared to ordinary CC cells. In contrast, the genes in cluster II were upregulated in the SCK cells and downregulated in the ordinary CC cells. Cluster I contained the GSTT1, TACSTD, BST2, RAB25, and MAL2 genes. Cluster II contained genes associated with tumor progression and metastasis, including HOXA9, MUC13, and members of the GAGE and CT-45 families. Expression of methylation-silenced genes, such as LDHB, BNIP3, UCHL1, and NPTX2, was barely detectable in the AC group, but appeared in this cluster.
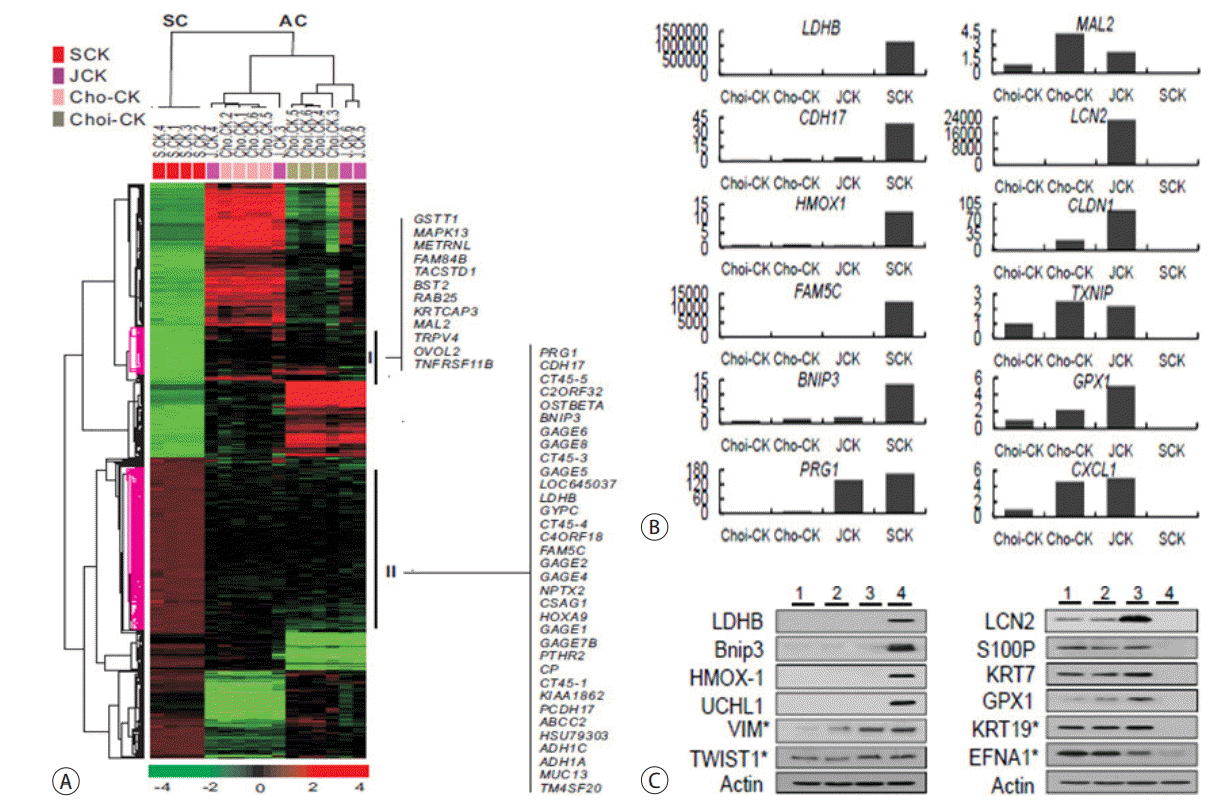
Genes and proteins differentially expressed in sarcomatoid CC and adenomatous CC cells. (A) Unsupervised hierarchical clustering separated the samples into two main groups: SC and AC. The samples were independently prepared from the cultured cells four times, and four kinds of CC cells were used: Choi-CK, Cho-CK, JCK and SCK cells. (B) Real-time RT-PCR analysis of upregulated (left) and downregulated (right) genes selected from the list of top 25 genes differentially expressed in sarcomatoid SCK cells and three adenocarcinomatous CC cell lines. (C) Immunoblot of upregulated (left) and down-regulated (right) proteins in sarcomtoid SCK cells compared to three adenocarcinomatous CC cell lines. *, selected from the top 100 genes differentially expressed in sarcomatoid SCK cells compared to three adenocarcinomatous CC cell lines. Lane 1, Choi-CK cells. Lane 2, Cho-CK cells. Lane 3, JCK cells, Lane 4, SCK cells. SC, sarcomatoid cholangiocarcinoma cells; AC, adenomatous cholangiocarcinoma cells; CC, cholangiocarcinoma; RT-PCR, reverse transcription polymerase chain reaction.
From 559 genes that were differentially regulated between SCK cells and the three ordinary CC lines, we selected six upregulated genes and six downregulated genes, and examined their mRNA expression using real-time RT-PCR (Fig. 4B), which verified the differential expression. We examined protein expression by Western blot analysis of the four CC lines. LDHB, Bnip3, HO-1, and UCHL1 were overexpressed exclusively in SCK cells. The expression of VIM and TWIST1 increased according to tumor dedifferentiation and was highest in SCK cells (Fig. 4C, left). In contrast, LCN2, S100P, KRT7, KRT19, GPX1, and EFNA1 were preferentially expressed in Choi-CK, Cho-CK and JCK cells, but minimally expressed in SCK cells (Fig. 4C, right).
In this study, our experimental design primarily investigated the gene expression profiles of 10 cell lines and 19 CC tissues, and compared these profiles to those from four cultured NBE cell line using genome-wide BeadChip microarray analysis. Gene expression profiling appears to be a useful diagnostic tool, especially for differentiating CC from other liver masses, as well as for the subclassification of intrahepatic CC compared to histopathological findings [12].
ANXA8 DOWN-REGULATION BY EGF-FOXO4 SIGNALING IS INVOLVED IN CELL SCATTERING AND TUMOR METASTASIS OF CHOLANGIOCARCINOMA
1. Down-regulation of ANXA8 and EGFR in CC cells
We previously established four distinct CC cell lines (SCK, JCK1, Cho-CK, and Choi-CK) and we analyzed their chromosomal aberrations by cross-species color banding [11,13]. The SCK, JCK and Cho-CK cells were originally derived from a peripheral type of intrahepatic CC. The Choi-CK cells were cultured from a hilar type of infiltrative CC. One of them (SCK) was derived from the sarcomatoid CC.
We assessed ANXA8 and EGFR protein expression according to tumor dedifferentiation in 3 CC cell lines and found that the expression was abruptly down-regulated with poor differentiation and sarcomatoid changes in JCK and SCK cells, respectively, as compared with the well and moderate differentiation in Choi-CK and Cho-CK cells, respectively (Fig. 5A). The expression of phosphorylated EGFR was proportional to the expression of EGFR. We next investigated whether the growth factors could induce cell phenotypic changes in the well-differentiated Choi-CK cells. EGF, but not hepatocyte growth factor or TGF-β, effectively induced rounding, refractile morphologic changes, and cell detachment (Fig. 5B). The down-regulation of EGFR and ANXA8 protein expression by exogenous EGF was time and dose dependent (Fig. 5C). To confirm the finding of transcriptional regulation of EGFR and ANXA8 by EGF, the ER1-luc and ANXA8-luc reporter plasmids were transiently transfected and assayed in Choi-CK cells treated with EGF. EGF effectively reduced the levels of EGFR and ANXA8 promoter activity to 61% and 43% of vehicle controls, respectively (p = .005) (Fig. 5D).
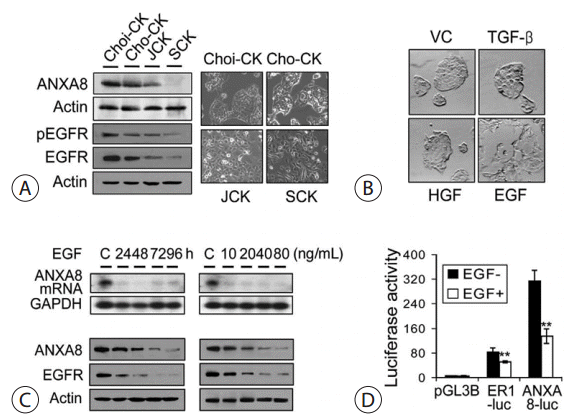
Down-regulation of ANXA8 and EGFR in CC cells. (A) The ANXA8 and EGFR expression according to tumor dedifferentiation in CC cells. The blots were probed with a polyclonal antibody to EGFR (1,005, 1:2,000 dilution), a polyclonal antibody to ANXA8 (C-20, 1:3,000) or a goat polyclonal antibody specific for Tyr-1173-phosphorylated EGFR (1:1,000),and then the blots were stripped and reprobed with a monoclonal antibody to actin as a loading control. Phase contrast images of the 4 CC monolayer cell lines (right). (B) The effect of EGF on the phenotypic changes of the Choi-CK cells. The cells were treated for 4 days with TGF-β (8 ng/mL), hepatocyte growth factor (HGF) (10 ng/mL), EGF (40 ng/mL), or vehicle control (VC). (C) The Choi-CK cells treated with EGF at 40 ng/mL for the indicated time intervals or those treated with various EGF concentrations for 4 days were then subjected to Northern blotting and immunoblot analyses for determining ANXA8 and EGFR protein expression. (D) The transcriptional regulation of EGFR and ANXA8 by EGF(40 ng/mL) was assessed in Choi-CK cells using a luciferase reporter with the EGFR promoter(-1,109 to -16 bp) and the ANXA8 promoter (-1,167 to+204 bp). pGL3Basic(pGL3B) was used as a control. The values represent the means ± SEMs from 3 independent experiments performed in duplicate (**p =.005; paired t test). CC, cholangiocarcinoma; EGFR, epidermal growth factor receptor; SEM, standard error of the mean.
2. Transcriptional Regulation of ANXA8 by FOXO4
Insulin or growth factor inhibits the transcriptional activity of FOXO4 by phosphorylation via phosphatidylinositol-3-kinase (PI3K)/Akt signaling. Therefore, we checked several downstream targets of EGF mediated ANXA8 regulation using an inhibition assay. Inhibiting PI3K and Akt resulted in higher levels of ANXA8 expression than inhibiting c-Jun N-terminal kinase (JNK), p38, and mitogen-activated protein kinases (MAPK)/extracellular signal-regulated kinases (ERK) kinase in Choi-CK cells, and the ANXA8 expression levels were abolished by the addition of EGF (Fig. 6A). PI3K/Akt, and not Ras/Ral, seems to be the major signal downstream of EGF-mediated ANXA8 regulation. The nuclear translocation of FOXO4 is reported to be negatively regulated through phosphorylation by Akt. Our data consistently show that FLAG-FOXO4 are recovered as phosphoproteins from transfected H-69 cells that are metabolically labeled with [32p]orthophosphate in the presence of the wild-type (WT)-Akt, activated (Act)-Akt or dominant negative (Dn)-Akt. FLAG-the triple mutant (TM)-FOXO4 was also processed in the presence of the activated Akt. The results show that FOXO4 is efficiently phosphorylated by WT-Akt and Act-Akt, whereas TMFOXO4, with 3 mutated phosphorylation sites, ie, T28A, S193A, and S258A, did not serve as a substrate (Fig. 6B). EGF increased the PI3K/Akt-induced phosphorylation of FOXO4 in the cytoplasm and simultaneously decreased the nuclear translocation of FOXO4 and subsequent down-regulation of ANXA8 expression, which was inhibited by the PI3K inhibitor wortmannin (Fig. 6C). The TM-FOXO4 increased the luciferase activity up to 5.3-fold, and the mutant of FOXO4, which lacks the DNA-binding domain, decreased the luciferase activity by half, as compared with WT-Akt (Fig. 6D). These findings suggest that FOXO4 and its phosphorylation can positively and negatively regulate ANXA8 promoter activity, respectively. The immunofluorescence data confirm that the ectopically expressed wild-type FOXO4 can translocalize to the nucleus with or without ANXA8 induction, whereas the TM-FOXO4 easily translocates to the nucleus and always induces the expression of ANXA8 (Fig. 6E).
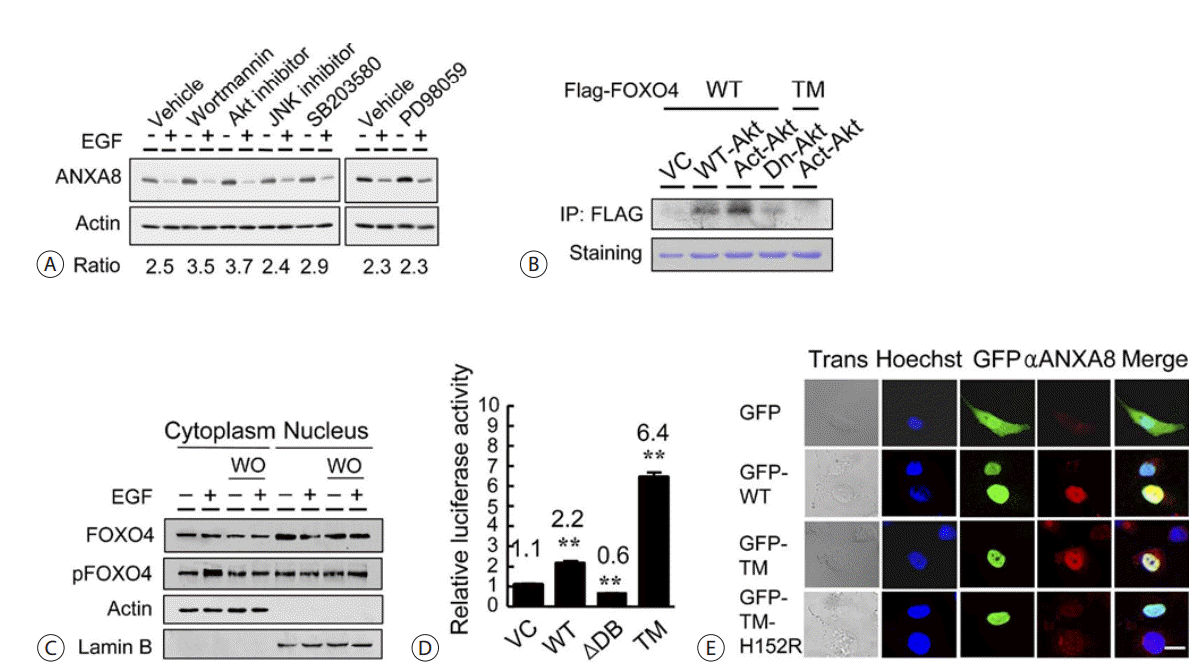
Transcriptional regulation of ANXA8 by FOXO4. (A) The Choi-CK cells were treated with various drugs as indicated and were grown further in the presence or absence of EGF. (B) The H-69 cells were transiently transfected with an empty vector (VC), the wild-type (WT)-Akt, the activated (Act)-Akt, or the dominant negative (Dn)-Akt. The FLAG-tagged FOXO4 or the FLAG-tagged triple mutant (TM)-FOXO4 was also cotransfected. The whole cell extracts, which were metabolically labeled for 3 hours with [32P]orthophosphate, were immunoprecipitated (IP) with a FLAG-specific resin and then electrophoresed. Coomassie staining was performed for the normalization of loading. (C) The Choi-CK cells were treated with wortmannin (WO) and then grown in the presence or absence of EGF. The cytoplasmic or nuclear extracts were subjected to immunoblotting with the antibodies to the indicated proteins. (D) Alterations of the ANXA8 promoter activity were measured in the 293T cells transiently cotransfected with the indicated expression vectors and the luciferase reporter that contained the ANXA8 promoter. WT, wild-type FOXO4; ΔDB, a mutant FOXO4 with a deletion of the DNA-binding domain; TM, the FOXO4 triple mutant; VC, the empty vector. The values represent the means ± SEMs from 3 independent experiments. t test, **p < .01. (E) Nuclear translocalization of the GFP-tagged WT-FOX04 or TM-FOXO4 and the concomitant ANXA8 expression in SCK cells transiently transfected with each plasmid. The cells were processed for indirect immunofluorescence with antibodies directed against ANXA8 (TRITC, red). The nuclei were stained with Hoechst 33258 (blue), and the cells were subsequently examined using confocal microscopy (Trans, transmission). Scale bar, 10μm. EGF, epidermal growth factor; Akt, protein kinase B; GFP, green fluorescent protein; TRIRC, tetramethylrhodamine.
3. ANXA8 Inhibits the Migratory and Metastatic Characteristics of CC Cells
The parental SCK cells and vector control cells (VC1 and VC3) readily penetrated the matrix and colonized the bottom surface of the Matrigel-coated membrane (a modified Boyden chamber assay), whereas the stable transfectants that expressed ANXA8 rarely showed this behavior (Fig. 7A). Next, the role of ANXA8 expression in the metastatic phenotype of the SCK cells was examined by implanting stable transfectants (200 µL of 5 × 10⁶ cells/mL) into the peritoneal cavity and monitoring the lethality over a 120-day period. The parental (SCK) and vector control cells that were inoculated intraperitoneally into the nude mice produced a distention of the abdomen, cachexia, and protruding abdominal masses. The mice bearing these tumors invariably died within 80 days. The stable ANXA8 transfectants produced no mortality until 80 days after intraperitoneal inoculation (Fig. 7B). A necropsy revealed that the parental cells or the vector control cells extensively colonized the visceral organs and formed multiple metastatic masses with bloody ascites. In contrast, the stable ANXA8 transfectants first colonized and then continued growing into the peritoneum with only rare metastatic nodules (Fig. 7C).
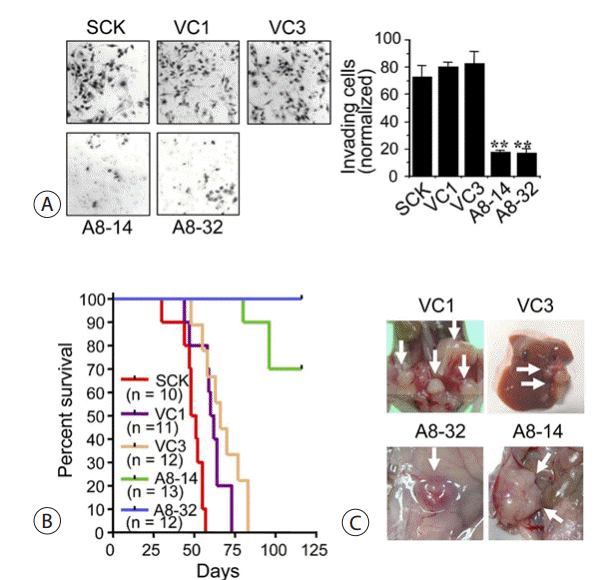
The effect of ANX A8 on the metastatic potential. (A)Photomicrographs of a modified Boyden chamber assay show numerous vector control cells, but only a few stable ANXA8 cells had traversed the Matrigel-coated membrane after 48 hours. Quantification of the cells that invaded was normalized to the viable cell mass on both sides of the membrane (right panel). t test, **p < .01 (B) Survival of the nude mice bearing intraperitoneal cholangiocarcinoma xenografts (n, number of experimental animals). The median survival times of the animals zenografted with the parental and vector control cells VC1 and VC3 were 49.5, 61, and 66 days, respectively. In contrast, little lethality was observed in the animals that were zenografted with the ANXA8 tranfsectants until 120 days after inoculation (p < .0001; log-rank test for significance). (C) The multiple tumor masses (white arrows) formed by the vector control cells (VC1) had invaded the visceral organs. Hepatic metastasis of a tumor formed by the vector control cells (VC3). The local growth of the zenografts by the A8-32 cells (30 days postinoculation) and the A8-14 cells (60 days postinoculation) on the parietal peritoneum(A8-32 and A8-14, respectively). VC, vector control.
In conclusion, ANXA8 is transcriptionally down-regulated by EGF-mediated FOXO4 phosphorylation and that the subsequent deregulation of FAK and F-actin dunamics is responsible for the morphology of EMT. Therefore, ANXA8 is functionally related to tumorigenesis, whereas its down-regulation is essential for tumor progression and metastasis.
ACTIVATION OF MAMMALIAN TARGET OF RAPAMYCIN COMPLEX 1 (MTORC1) AND RAF/PYK2 BY GROWTH FACTOR-MEDIATED EPH RECEPTOR 2 (EPHA2) IS REQUIRED FOR CHOLANGIOCARCINOMA GROWTH AND METASTASIS
1. EphA2 Expression According to the Level of Differentiation in CC
We previously described four CC cells with varying levels of differentiation, including well differentiated Choi-CK, moderately differentiated Cho-CK, poorly differentiated JCK, and sarcomatoid SCK cells. EphA2 expression was more prominent in less-differentiated CC cells, such as JCK and SCK cells (Fig. 8A). However, both of these cell types showed lower expression levels of the known EphA2 ligand, EFNA1, as well as EGFR, compared to the better-differentiated Choi-CK and Cho-CK cells. Accordingly, EphA2 transcript levels were elevated in poorly differentiated JCK and SCK cells. IHC examination of EphA2 expression in CC tissues revealed that normal bile duct epithelial cells were negative or barely positive for EphA2 immunoreactivity. As expected, the poorly differentiated CC tissues were more strongly positive for EphA2 than the better-differentiated CC tissues (Fig. 8B). These results suggest that EphA2 expression correlates with poorer differentiation and more progression in CCs. Among the various growth factors tested, EGF induced EphA2 expression and reciprocal inhibition of EFNA1 in CC cells (Fig. 8C, upper panels). Therefore, EGF seems to transcriptionally regulate EphA2 and EFNA1. The EGF-mediated morphological changes were consistent with EMT changes (Fig. 8D), as we previously described. Among the cells treated with various growth factors, the promoter activity of EphA2 was highest in the EGF-treated cells (Fig. 8E). EGF dose-dependently induced EphA2 overexpression and phosphorylation on S897, but not on Y594 (Fig. 8F). These results suggest that aberrant expression of EphA2 resulting from abnormal growth factor signaling is crucial for tumor promotion and metastasis and this abnormal growth factor signaling contributes to the down-regulation of EFNA1 and EGFR.
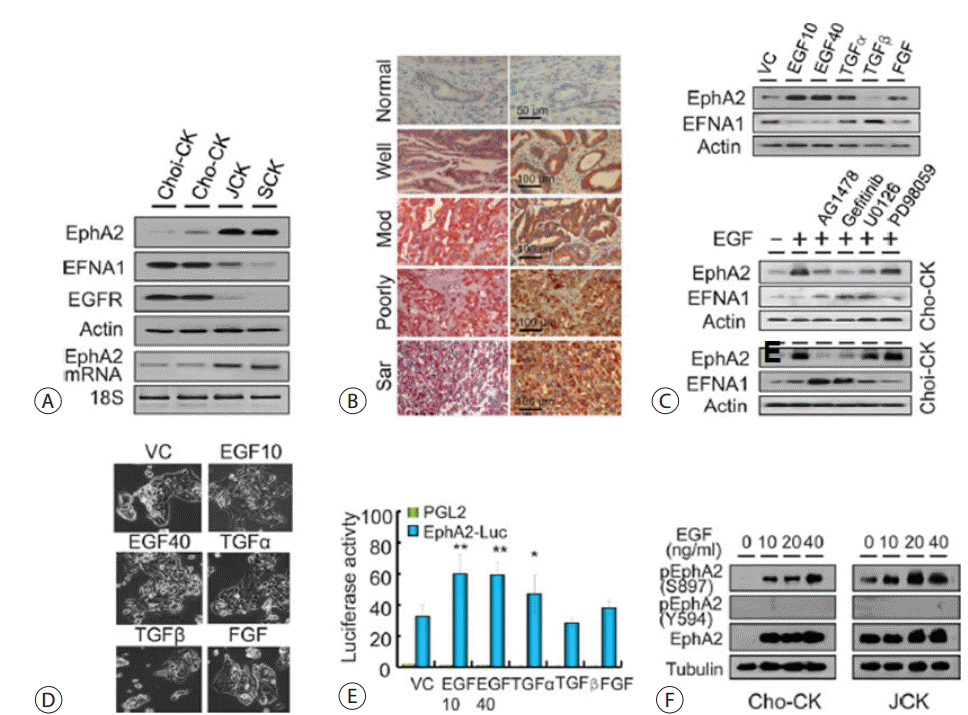
EphA2 expression in cholangiocarcinoma cells. (A) EphA2, Ephrin A1, and EGFR expression according to the level of differentiation in CC cells. A semiquantitative RT polymerase chain reaction assay was performed to determine the EphA2mRNA level in the CC cells. (B) Immunohistochemical detection of EphA2 in CCs according to differentiation (Mod,moderate; Sar, sarcomatoid). The results shown are representative of three independent experiments (n = 3). (C)Regulation of EFNA1 and EphA2 by growth factors such as EGF (10 or 40 ng/mL), TGF- (10 ng/mL), TGF-β (10 ng/mL), and FGF (20 ng/mL) (upper panels). Blockage of EGF-mediated EphA2 induction by receptor tyrosine kinase inhibitors (5 μMAG1478 and 2 μM gefitinib) and MEK/ERK inhibitors (10 μM U01226 and 50 μM PD98059) in Cho-CK cells treated with the drugs for 48 hours (lower panels). The results shown are representative of three independent experiments. (D) EMT-like morphological changes of CC cells treated with various growth factors. (E) Increased promoter activity of EphA2 in Cho-CK cells induced by various growth factors. Each bar represents the mean ± SEM. *p < 0.05; **p < 0.01. (F) EGF-mediated EphA2 expression and phosphorylation at S897 in Cho-CK and JCK cells. The results shown are representative of three independent experiments. VC, vehicle control; EGF, epidermal growth factor; TGF, transforming growth factor; CC, cholangiocarcinoma; SEM, standard error of the mean.
2. Morphological Changes Caused by EphA2
Overexpression of EphA2 is correlated with disease progression and highly malignant cellular phenotypes. We therefore investigated the morphological changes induced by EphA2 overexpression in Cho-CK cells. EphA2 expression was examined in stably transfected Cho-CK cells by immunoblot analysis (Fig. 9A). The stable transfectants expressing EphA2 (A2-20 and A2-22) showed a more migratory and less adhesive phenotype compared to the vector control cells (VC4 and VC10) (Fig. 9B). To assess the ligand-mediated EphA2 expression, we treated the SCK cells with recombinant mouse ephrin-A1 Fc ligand and found that it efficiently down-regulated EphA2 expression in a dose-dependent manner compared to treatment with recombinant human IgG1-Fc. EGF treatment resulted in an increase in EphA2 expression and phosphorylation at S897, but not Y594. In contrast, the ephrin-A1 Fc ligand decreased EphA2 expression, but increased phosphorylation of EphA2 at Y594 (Fig. 9C). The cell morphology changed from fibroblastoid type to epitheloid type, i.e., reverse EMT (mesenchymal-eipthelial trasition) (Fig. 9D). Alternatively, we examined the F-actin staining of stress fibers with fluorescent phalloidin in the EphA2-expressing cells treated with either recombinant IgG1-Fc or recombinant ephrin-A1 Fc ligand. Treatment with recombinant ephrin-A1 Fc ligand resulted in repressed expression of EphA2 and the formation of F-actin stress fibers (Fig. 9E).
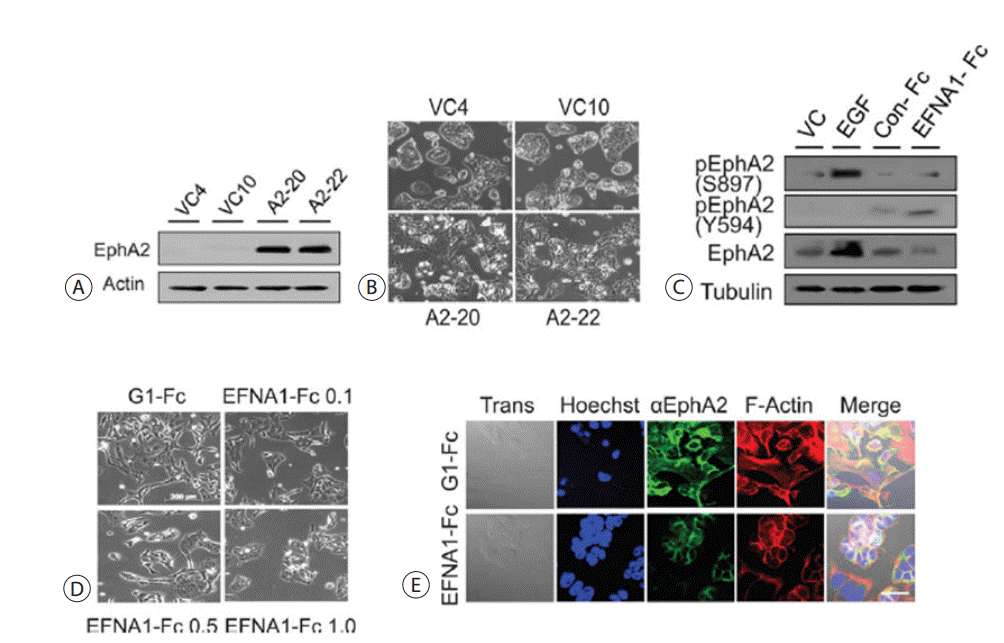
Morphological changes according to EphA2 expression and subcellular localization. (A) Western blot analysis of EphA2 in Cho-CK cells stably expressing the EphA2 protein. (B) Morphological changes in stable transfectants (A2-20 and A2-22) were compared with those of the vector control cells (VC-4 and VC-10). (C) Regulation and phosphorylation of EphA2 in Cho-CK cells treated with EGF (40 ng/mL) or EFNA1-Fc (1 μg/mL) for three days compared with the Fc-control cells (1 μg/mL). The results shown are representative of three independent experiments. (D) Morphological reversion of fibroblastoid SCK cells to epitheloid cells induced by treatment with EFNA1-Fc (μg/mL). (E) SCK cells stably expressing EphA2 were processed for immunofluorescence staining for EphA2 (green) and F-actin (red). EphA2 was suppressed in association with F-actin by EFNA1-Fc in SCK cells. Scale bar = 20 μm. VC, vector control; EGF, epidermal growth fator.
3. Enhanced Tumorigenicity of EphA2
In order to determine if human EphA2 has pro-oncogenic properties, the capacity of EphA2 to anchor independent cell growth was compared to vector control cells by determining the level of colony growth on soft agar. The stable EphA2 transfectants formed a greater number of larger colonies on soft agar (Fig. 10A). Furthermore, tumor growth was orthotopically or subcutaneously faster in the mouse tumor model with the stable transfectants than with vector control cells (Fig. 10B). These results suggest that EphA2 plays a crucial role in tumor growth in vitro and in vivo. In addition, intrahepatic tumor metastases were more enhanced in orthotopic xenoplants from the stable EphA2 transfectants than from the vector control cells.

Enhanced tumorigenicity of Cho-CK cells induced by EphA2. (A)Cho-CK cells stably expressing EphA2 generated more and much larger colonies on soft agar than the vector control cells. The graph shows quantification of colony numbers (lower panel). Each bar represents the mean ± SEM. (B) Growth of the tumor masses and their intrahepatic metastases from EphA2-expressing cells (A2-20 and A2-22) and vector control cells (VC-4 and VC-10) that were injected into the liver of nude mice (upper). The main tumor volume and the number of tumor nodules were quantified 5 weeks after orthotopic transplantation. Each value represents the mean ± SEM (n = 7). VC, vehicle control; SEM, standard error of the mean.
4. Migratory and Metastatic Abilities Induced by EphA2
The EMT of epithelial cancers is correlated with aggressive tumors that are believed to play a critical role in metastatic cancer. We therefore examined whether EphA2 overexpression contributed to tumor invasiveness and metastasis by affecting the EMT phenomena in CC cells. We found that adhesion molecules such as E-cadherin and desmoplakin I/II were down-regulated, and locomotion molecules, including fibronectin, vimentin (VIM), N-cadherin, and alpha smooth muscle actin, were up-regulated in the cells stably expressing EphA2 (Fig. 11A). Wound repair assays were performed on Cho-CK cells stably expressing EphA2, and the stable transfectants demonstrated a visibly enhanced capacity to migrate into the wounded area compared to the vector control cells (Fig. 11B). In a modified Boyden chamber assay, the stable transfectants readily penetrated the matrix and colonized the bottom surface of the Matrigelcoated membrane, while the vector control cells did not (Fig. 11C). Therefore, EphA2 expression appeared to enhance the invasiveness of these cells. The role of EphA2 expression in the metastatic phenotype of the Cho-CK cells was examined by first injecting stable transfectants (100 µL of 5 × 10⁵ cells/mL) into the tail vein of nude mice and subsequently monitoring multiple metastatic nodules in the lungs. The stable EphA2 transfectants first colonized and then continued growing into the lungs with many more metastatic nodules (black arrowhead) than were achieved with the vector control cells (Fig. 11D). A histocytological examination confirmed these results (Fig. 11E). Many metastatic nodules strongly expressed EphA2 in the lungs.
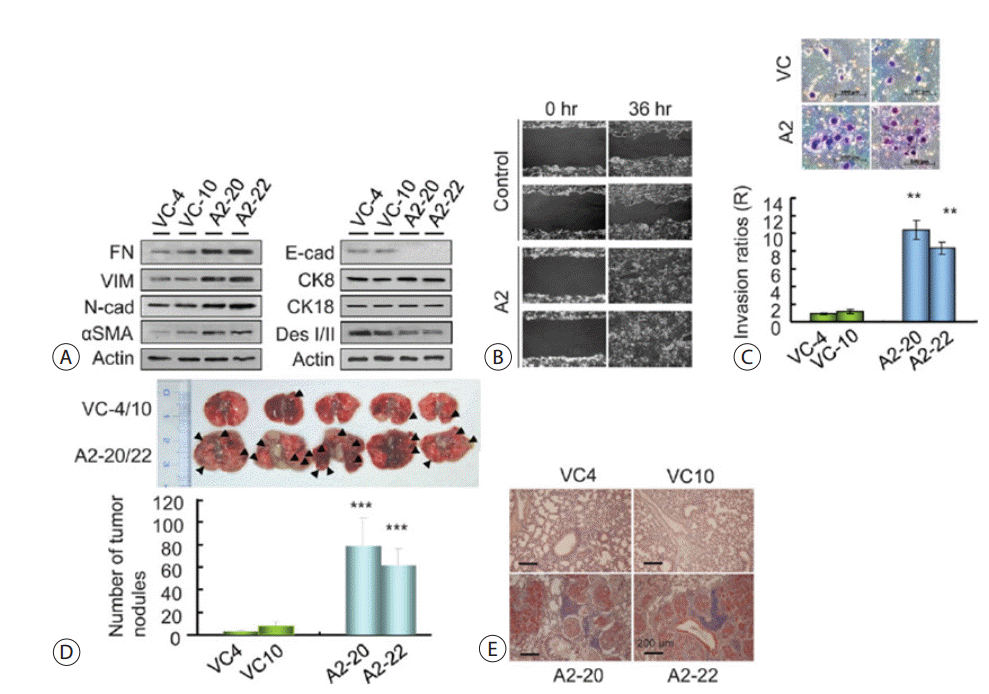
Migratory and metastatic abilities induced by EphA2. (A) Western blot analyses showed acquisition of mesenchymal and loss of epithelial marker proteins in the stable EphA2 transfectants, compared with vector control cells. The results shown are representative of three independent experiments. (B) Migratory ability was determined in the Cho-CK cells stably expressing EphA2 by way of the wound healing assay. Phase contrast images were taken 36 hours later to assess cell migration. The results shown are representative of three independent experiments. (C) Photomicrographs of a modified Boyden chamber assay show numerous stable EphA2 transfectants while only a few vector control cells had traversed the Matrigel-coated membrane after 48 hours. The cells that invaded were normalized to the viable cell mass on both sides of the membrane (right panel). Each bar represents the mean ± SEM. **p < 0.01. (D) Mice were inoculated with 5 × 10⁵ Cho-CK cells, transfected as indicated, by way of the tail vein. Forty-five days after tumor implantation, animals were euthanized and the lungs were evaluated for tumor nodules. The graph shows results from two independent experiments conducted in four groups (n = 5). Black arrowheads indicate metastatic nodules. Each bar represents the mean ± SEM. ***p < 0.001. (E) Immunohistochemistry for EphA2 in the numerous metastatic nodules observed in the lungs of the mice. Scale bars = 200 μm. FN, fibronectin; VIM, vimentin; N-cad, N-cadherin; αSMA, alpha smooth muscle actin; E-cad, E-cadherin; CK, cytokeratin; Des, desmoplakin; SEM, standard error of the mean.
5. Downstream Signaling of EphA2
Next, we sought to identify the phosphorylation of downstream molecules using Human Phospho-Kinase Arrays (Fig. 12A). EphA2 overexpression led to phosphorylation of Akt and Pyk2, as confirmed by immunoblot and immunoprecipitation, respectively (Fig. 12B). Akt phosphorylation occurred at T308 and Pyk2 at Y402 in both JCK and SCK cells. However, other phosphorylation sites, S473 of Akt and Y881 of Pyk2, were not affected by EphA2. Mammalian target of rapamycin (mTOR) is known to function downstream of Akt as part of the mTOR complex 1 (mTORC1) protein complex.28,29 We therefore investigated the mTORC1 pathway in stable EphA2 transfectants of the four CC cell lines. EphA2 overexpression resulted in phosphorylation of mTORC1, 4EBP1, and p70S6K in JCK and SCK cells (Fig. 12C). EphA2 overexpression also led to c-Src phosphorylation (Fig. 12D). The knockdown experiments revealed that EphA2 knockdown itself resulted in EFNA1 induction and was linked to the inhibition of canonical upstream activators of ERK signaling, including b/c-Raf and MEK (Fig. 12E).
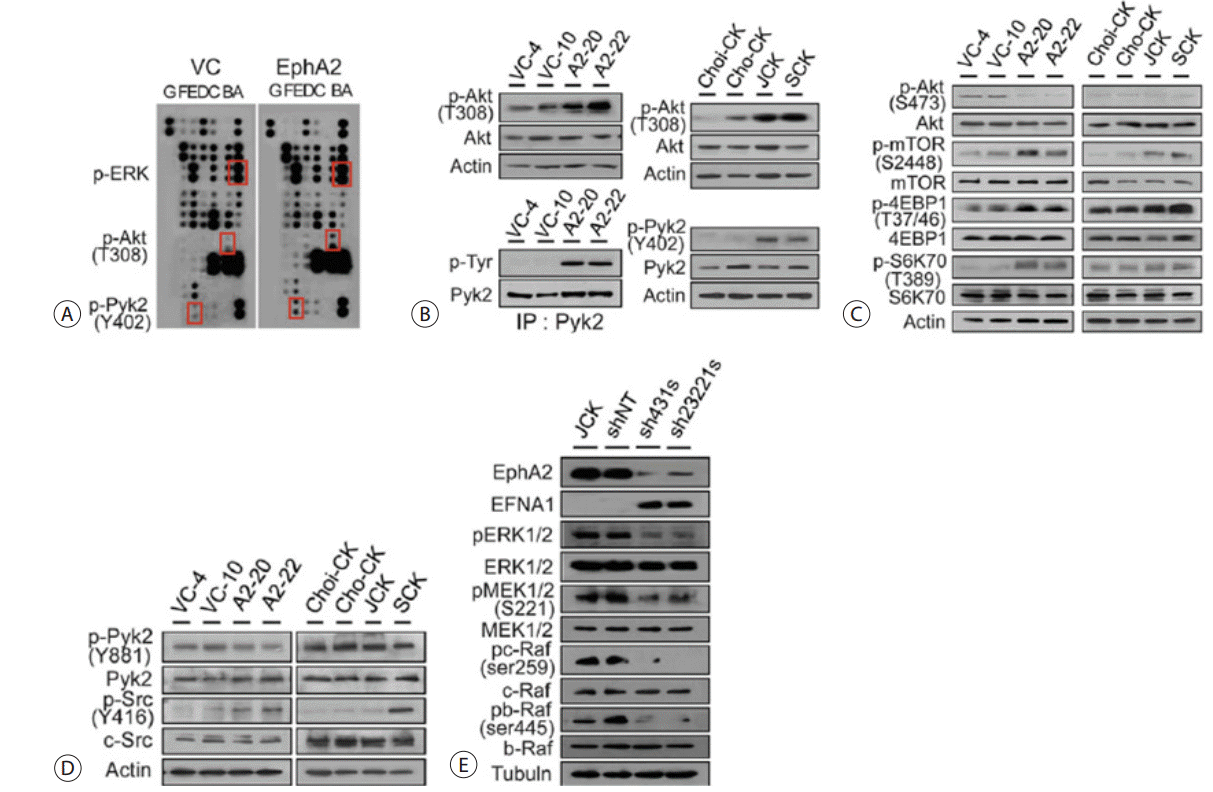
Migratory and metastatic abilities induced by EphA2. (A) Dot blot screens using the Phospho-Kinase Array Kit based on spotted pairs (vertical doublets) of antibodies for the signaling proteins indicated in the upper and lower boxes (Akt and Pyk2). The phosphorylation state was determined using a mixture of phosphopeptide-specific antibodies. The two doublets in the corners are internal positive controls. The results shown are representative of three independent experiments. (B) Phosphorylation of Akt and Pyk2 by immunoblot and immunoprecipitation assays in the stable EphA2 transfectants compared to the vector control cells (left); phosphoactivation of Akt and Pyk2 in the four CC cell lines (right). The results shown are representative of three independent experiments. (C) Activation of Akt and mTORC1 in the stable EphA2 transfectants compared to the vector control cells (left); activation of Akt and mTORC1 in the four CC cell lines (right). The results shown are representative of three independent experiments. (D)Activation of Pyk2 and c-Src in the stable EphA2 transfectants compared to the vector control cells (left); activation of Pyk2 and c-Src in the four CC cell lines (right). The results shown are representative of three independent experiments. (E) Inhibition of the c-Raf/MEK/ERK pathway by EphA2 knockdown with lentiviral delivery of shRNA. The results shown are representative of three independent experiments. VC, vector control; ERK, Extracellular signal-regulated kinases; IP, immunoprecipitation; CC, cholangiocarcinoma.
6. Proliferation and Metastatic Ability of Akt/mTORC1 and c-Src Activation
In the wound healing assay, 4-Amino-3-(4-chlorophenyl) -1-(t-butyl)-1H-pyrazolo[3,4-d]pyrimidine (PP2) completely inhibited EphA2-mediated wound closure. Rapamycin, however, caused only a partial inhibition of wound repair (Fig. 13A). The Matrigel-coated transwell invasion assay similarly showed that PP2 completely inhibited invasion of Matrigel pores, while rapamycin provided only partial inhibition (Fig. 13B). These results suggest that the Akt/mTORC1 pathway plays a major role in regulating cell proliferation while the Pyk2/c-Src pathway generally acts to modulate metastatic ability. However, the Akt/mTOR and Pyk2/c-Src pathways also appeared to substantially influence each other. We further examined the morphological changes occurring in the stable transfectants expressing EphA2 after rapamycin or PP2 treatment. Rapamycin partially inhibited the migratory characteristics and stress fiber formation, while PP2 completely suppressed these phenomena (Fig. 13C).
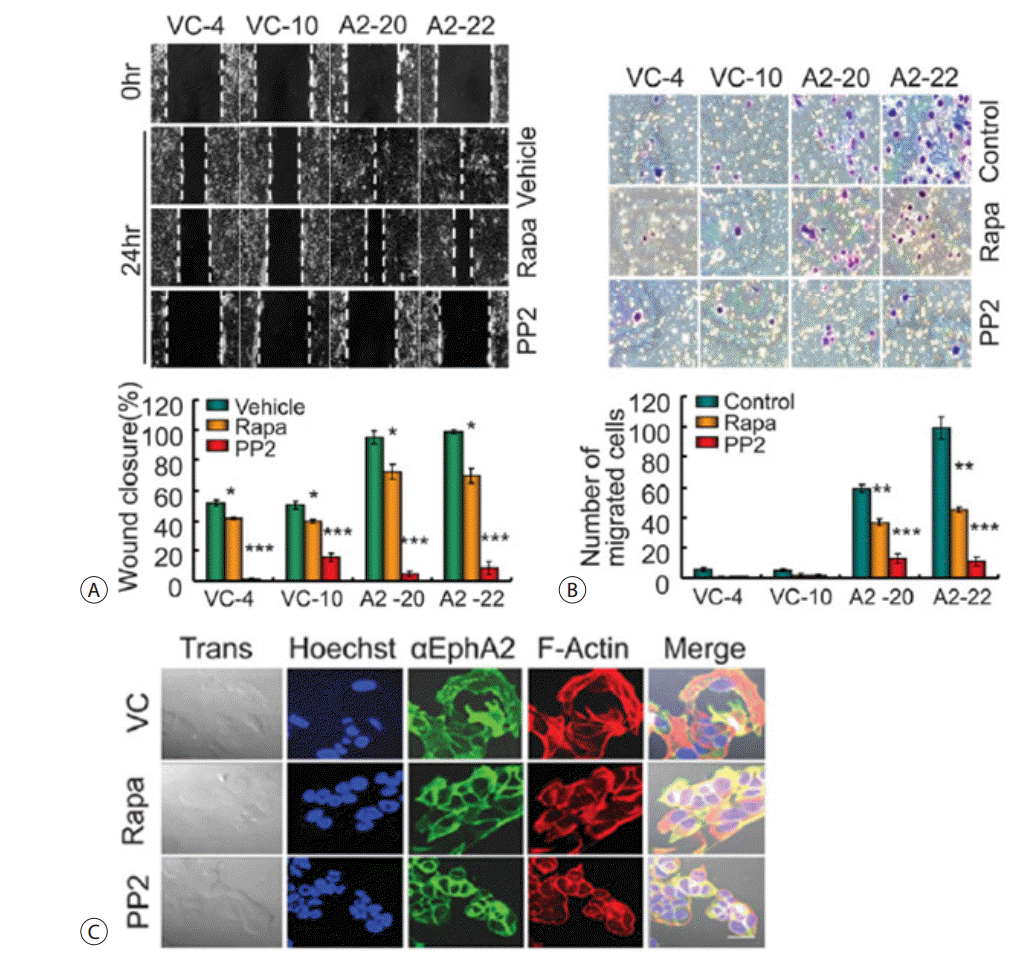
Inhibition of tumor cell proliferation and metastatic ability. (A) The wound healing assay demonstrated complete and partial inhibition of EphA2-mediated wound closure by PP2 and rapamycin, respectively. Quantitative measurements are shown. Each bar represents the mean ± SEM (n = 3). *p < 0.05 and ***p < 0.001 (n = 3). (B) The Matrigel assay revealed a significant number of EphA2 transfectants invading through pores, which was significantly inhibited by PP2, but less inhibited by rapamycin. Quantitative measurements are shown. Each bar represents the mean ± SEM (n = 3). **p < 0.01 and ***p < 0.001. (C) Morphological changes in stable EphA2 transfectants after treatment with rapamycin (Rapa, 20 ng/mL) or PP2 (10 μM). Immunofluorescent staining for EphA2 (FITC, green) and F-actin (phalloidin-TRITC, red). Scale bar = 20μm. VC, vehicle control; PP, 4-Amino-3-(4-chlorophenyl)-1-(t-butyl)-1H-pyrazolo[3,4-d]pyrimidine; SEM, standard error of the mean; FITC, fluorescein isothiocyanate; TRITC, tetramethylrhodamine.
To exclude the cell-specific function of EphA2 we used metastasis-prone CC cells, JCK, to determine whether EphA2 expression is critical for metastasis of CC cells because these cells express high levels of EphA2. EphA2 knockdown cells were established by lentiviral delivery of EphA2 shRNA with stable expression of luciferase (JCK-luc) (Fig. 14A). The metastatic phenotype of the JCK-luc cells was examined by injection into the tail veins (100 µL of 5 × 10⁵ cells/mL) of nude mice. Sufficient bioluminescence data were collected at 4 weeks postinjection (Fig. 14B). The parent and non-target cells first colonized and then continued growing into the lungs with many metastatic nodules (Fig. 14C). A histological examination demonstrated that injection of the parent and nontarget cells resulted in numerous EphA2-positive metastatic lesions, and the target cell injection resulted in EphA2-negative and fewer metastatic nodules. These results suggest that EphA2 expression plays a major role in tumor metastasis and invasion in CC cells.

Inhibition of the metastatic ability of JCK cells by EphA2 knockdown. (A) Knockdown of EphA2 expression in JCK cells by the lentiviral delivery of nontarget (shNT) or target shRNA (sh413s and sh3352s). (B) Bioluminescent images demonstrate that parent and nontarget tumor cells spread to the lungs (n = 6 mice/group, representative anterior-posterior images, 1 minute exposure time). Quantitative measurement of photon flux (right). Each bar represents the mean ± SEM. ***p < 0.001. (C) Immunohistochemical staining of EphA2 in metastatic nodules. Scale bars = 500 μm. (D) Schematic model of EGF/EphA2-mediated tumor growth and metastasis through the Akt/mTORC1 and Pyk2/c-Src pathways. p, phosphorylation; shNT, short hairpin RNA non target; EGF, epidermal growth fator; EGFR, epidermal growth fator receptor; SEM, standard error of the mean.
In addition to the canonical Raf/MEK activation, overexpression of EphA leads to activation of Akt and Pyk2 by phosphorylation. In turn, activated Akt and Pyk2 phosphorylate mTORC1 and c-Src, respectively. The activation of molecules downstream of mTORC1 and ERK contribute to tumor growth and/or metastasis in CCs (Fig. 14D) [14].
THERANOSTICS-BASED IDENTIFICATION OF TARGET MOLECULES FOR DIAGNOSIS AND THERAPY IN CHOLANGIOCARCINOMA
To control cholangiocarcinoma growth and metastasis, we screened EphA2 kinase inhibitor by homogeneous time resolved fluorescence (HTRF). Thirty substances were founded and we validated these substances related to inhibit cell proliferation and cell death. Human cholangiocarcinoma cell lines, Choi-CK, Cho-CK, JCK and SCK were treated various concentration of EKI, EphA2 kinase inhibitor (1, 2.5, 5, 10, 25 µM) for 24h. At 1 and 2.5 µM of EKI, proliferation of these cells was inhibited. At 5 µM of EKI, cell death was induced in these cells. As quantitatively assessed by flow cytometry, apoptosis was induced by EKI in CC cells. We investigated apoptotic signaling by Western blot and observed cleavage or overexpression of pro-caspase-3 and PARP in EKI treated cells compared with vehicle. We investigated EKI up-or down-signal transdection pathways in cholangiocarcinoma to use therapeutic target for CC. Therefore, the EphA2 kinase inhibitor EKI is therapeutic target for cholnagiocarcinoma.
Notes
Conflict of Interest
The author has no conflict to disclose.